Loading...
Loading...

Home Page

Loading Loading

Map Item Details

Radius Search

Total:

Loading Loading

Map Item Details

Loading Loading

Add Comment

Loading Loading

CRM Company Lookup

Enter a Company ID to view CRM details:

Welcome

Select Area

  • Draw a shape on the map
  • Use the Search Tools to select one or more locations

View Data stats

  • Explore jobs, population and more, on the map
  • Select View Data to see more
Start Exploring
The block groups selected will not always match outline of the area drawn.
Got it!

Welcome

(-- Block Groups)
Population:
Jobs:

Welcome

(-- Block Groups)
Population

Total Workforce

Household Income (Annual)


View All Data
Loading Loading

Select an item from the list

Name: {{name}}
loading spinner
Initializing
Map Layers

Modal title

...
Show Dashboard

Search for a Location

Get Started

Select Location Type

Select Location Type

Address
Zip Code
City
County
State
School Districts
State Leg. Dist.

As you type, search suggestions will automatically appear below. Use the arrow keys to move through the suggestions and press Enter or Space to select one.

Search
Select one or more results below and click apply.

Nearby Areas

Search Results

        Select a Custom Area

        • Circle
        • Draw-Rectangle Rectangle
        • Freeform

        Map Options

        Change Map View

        Street
        Gray
        Satellite

        Program Layers

        Overlay Layers

        Toggle to Show Values

        Toggle to Add Map Layer

        Additional Map Layers

        Search for additional map layers.

        Help & Feedback

        Help

        Having trouble with the site? Let us know!

        Contact Us

        For more information, please contact us here.

        JOIN SHAPES
        CANCEL
        Clear Parcels

        The Community Opportunity Map displays child and family well-being indicators across communities. Use the map controls to explore neighborhoods, toggle layers, and review related details.

        Add a comment

        CAI Live - Community Attributes Inc.

        Please select a location to continue...

        Loading...

        CRM Test

        Area Selection Required

        The dashboard requires a geographic selection to display data. Choose one of the following:

        Search and Select

        Search by available options to select a new area
        Custom Area Select

        Draw a custom area
        Reset

        Reset map to default
        Loading Loading
        ;
        A Problem Occurred
        ×
        JOIN SHAPES
        CANCEL

        Share Link

        ×
        Loading Loading

        Select an item from the list

        Name: {{name}}

        About

        About CAI Live

        Community Attributes Inc. has developed a suite of online data mapping applications for real estate, economic dvelopment, and planning practitioners. Our robust and extensible platform helps make sense of complex data layers, and allows non-experts to engage with sophisticated analysis techniques. Scroll down for more information and examples of how CAI has been adapted to promote the arts, advance equity, and protect children..

        Case Studies

        Casey Family Programs

        Using the Casey Family Programs childhood welfare indicators, Community Attributes Inc. built an interactive map to help community members, advocates and policymakers promote wellbeing for families and children. The dashboard for children's health is a means to engage in data-rich discussions about increasing opportunity for the next generation.

        https://community-opportunity-map.casey.org

        Casey Family Programs

        Tacoma Equity Map

        The City of Tacoma has built their 2025 comprehensive plan around the concept of equity, specifically defined using local and national data. Community Attributes Inc. created the Tacoma Equity Map to empower community groups and citizens to engage with the data and advocate for fairer policies and practices. Some public investments like new street lights and sidewalks are now allocated considering the Equity Index to help the city become more equitable.

        https://tacomaequitymap.caimaps.info

        Tacoma Equity Map
        Free Trial
        Version
        Full
        Version
        Census Demographic Data✔✔
        Seattle Parcel Data✔✔
        Health Data✔✔
        Custom Area Select✔✔
        Data is Current and Regularly Updated✔
        Map Business Points✔
        Export Data✔
        Export to PDF for Printing✔
        Additional Data Regularly Added✔
        Contact cailive@communityattributes.com today to upgrade!
        Community Attributes Inc.
        Port of Seattle Equity Index
        The Port of Seattle's Equity Index is an interactive map that displays a visual representation of social and environmental disparities in King County. It uses 19 indicators in four categories to determine pollution burden and social inequities in communities across the region. This index serves as a tool for the Port to integrate equity data into decisions about programs, policies, and resources.
        Economy

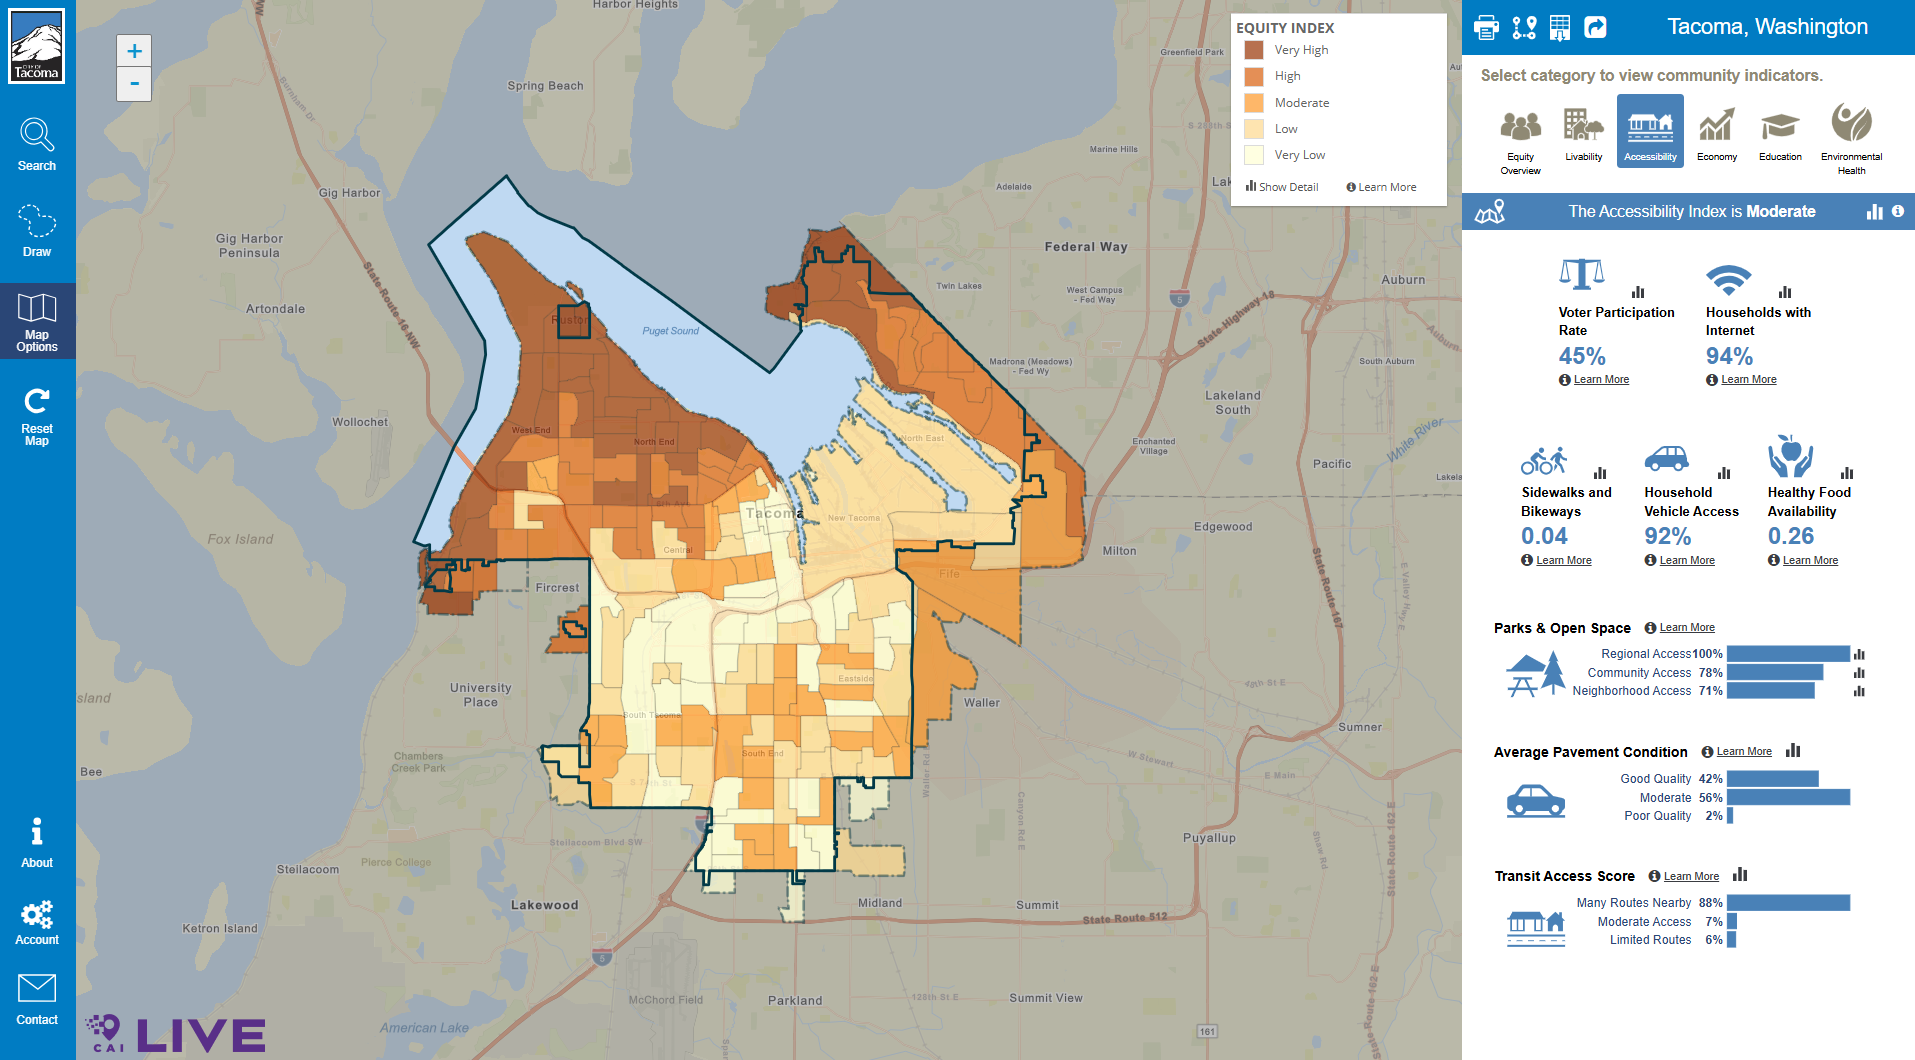
        Indicators related to creation, retention, transfer, and accumulation of wealth within a community

        Livability

        Indicators that demonstrate a safe and healthy standard of living

        Accessibility

        Indicators that advance the standard of living in a community so that people can fully access and participate in public life

        Environment

        Indicators that represent the health and vitality of the environment

        CAI Live - Community Attributes Inc.

        Data analysis and application by Community Attributes, Inc.